How Long Will My Home Take To Sell?

You’ve decided to put your beautiful Palo Alto home on the market – congratulations!  Whether you are downsizing, upsizing, cashing in, or doubling down, most homeowners want to know how long the process will take.

So, what can you expect for your home?  What are the trends?  What about older homes, larger homes, larger lots, or more expensive homes?  Let’s dig in and see what the data says.

This is a picture that shows the days on market analysis

Days on Market Analysis

Executive Summary

  • The median Palo Alto home sells in 9 days

  • The month of listing does not matter

  • For homes under $4million, home size, lot size, and sale price do not matter

  • More expensive homes take longer to sell

  • 90% of Palo Alto homes sell in under 39 days of going on the market


Methodology Note

All data in this analysis comes from MLS data for Single Family Residences (SFRs) in Palo Alto between 1/1/2013 and 7/29/2018.  There were 2,062 transactions in that 5.5 year timespan.  One was excluded due to obviously incorrect data entry.  Off-market sales, and listings that did not result in a sale are not considered.


Median Days on Market

There is an incredible macro stability in Palo Alto’s DOM.  The median home sells 9 days after going on the market:

This is a graph that shows the median days on market by year

What was happening in 2016?  There was a mini-slowdown for half the year, but then things regained their (otherwise impressively consistent) 9-day DOM.

Let’s scatterplot the actual datapoints for over 2,000 transactions in Palo Alto against when they went on the market (Listing Date), and examine whether the distribution is changing at all:

This is a graph that shows the days on market from 2013

The most obvious thing about the chart above is that there are breaks in December every year… people typically don’t buy and sell homes over the holidays!  However, there is not an obvious difference in the distribution of the DOM from one year to the next.  Perhaps you can say that the “high outliers” are becoming less common lately… but these are not terribly material compared to the large mass of homes that last 1-2 weeks (where all the blue dots cluster year after year)

Conclusion: Days on Market has been remarkably stable over the past 5 years; the median home sells in 9 days.

Seasonality

So.. while we’re looking seasonality, does it make a difference *when* during the year you list your home?

This is a graph that shows the average days on Market by listing month

In the chart above, the Y-axis is the average Days on Market.  The color and data label represent the volume of homes sold, with green meaning “lots” and red meaning “few”.  The averages do change a bit from month to month, but this is probably just statistical noise.  The average DOM is between 14-22, no matter what month things are listed in.  Notice that in the peak months of March, April, May (spring rush) and September (fall rush) there are 5-7x more houses than in the quietest month (December), though DOM does not seem to suffer much because of it.

OK, that was average, which might over-represent outliers.  What about the median?

This is a graph that shows the median days on market by listing month

Ah, now we are back to our standard “9 days on market” in most months, with a mild increase in summer and winter.  Why the difference between average and median?  Some outlier homes take a loooong time to sell, which moves the average up but not the median.

Conclusion:  the timing within the year when a home is listed does not materially affect its speed to sell.

Does Speed Change With Size or Price?

What about bigger homes?  Conventional wisdom would say that a home with 2,000 square feet will move faster than one with 10,000.  Does the data agree?

This is a graph that shows whether bigger homes sell slower

Not really!  We might have expected an upward sloping cluster, but it just doesn’t seem to happen that way.  The bulk of all homes do seem to sell close to that 9-day median, regardless of size of the home.

What about lot size?  Perhaps a half-acre in the hills moves more slowly than a typical Palo Alto lot of 5-6,000 square feet?  Is there any obvious difference?

This graph asks the question, Do Bigger Lots Sell slower?

Again, not really!  Comparing the square feet of lots, the splatter of blue dots is pretty consistent as a horizontal line:  no matter what the lot size, most of the data looks like DOM is unrelated.

OK one more shot at it:  is the Sale Price related to how fast a home remains on the market?

This graph asks the question, Do more expensive homes sell slower?

Not obviously, at least for homes up to $4,000,000 or so.  After that, the baseline disappears, but the high outliers remain.  This reflects both the relative scarcity of such high-priced transactions, as well as a discernable pattern of more expensive homes taking longer to sell.  The math is not super-convincing due to the small sample size, however.

Conclusion: Home size, lot size, and sale price are not strongly correlated with how long a property remains on the market, though sale prices above $4,000,000 do seem to suggest longer times to sell.

Does Speed Change With Home Age?

Let’s consider when a home was completed:

This graph asks the question, Do older homes sell slower?

The first thing that strikes us is the notable clusters of houses built in the 1950s (hello, Eichlers!) and the spike in the past 8 years.  Your perception that there is a lot of construction lately is well-supported by data!

Now, aside from the clusters of building activity, are Days on Market affected by the year of construction?  Not hugely, though lately the distribution seems to be widening.  Given the global attraction of Palo Alto, it may be the case that some developers are setting more aggressive list prices, resulting in slower sales.  It does not show up in the median, but the distribution does look more… distributed.

Conclusion: Year of Construction has traditionally not affected DOM, though this may be changing for new construction.

39-day Listing Period?

Some real estate professionals have been touting a promise to sell a home within 39 days, or the deal is off.  What is going on here?  Is that a valuable promise? What are the odds this happens anyways? 

The granular data above would suggest that most homes do indeed sell within 39 days of going on the market.  In fact, if we bucket Palo Alto’s past 5 years of sales, here is the math versus the marketing:

90% of Palo Alto homes sell within 39 days!  Only 10% go to 40 and above

Actually, 90% of Palo Alto homes sell within 39 days!  Only 10% go to 40 and above.

And what about the price of those 10%?  Do they tend to be the more expensive ones?

This is a graph that shows the average sales price by days on market
This is a graph that shows the median sale price by days on market

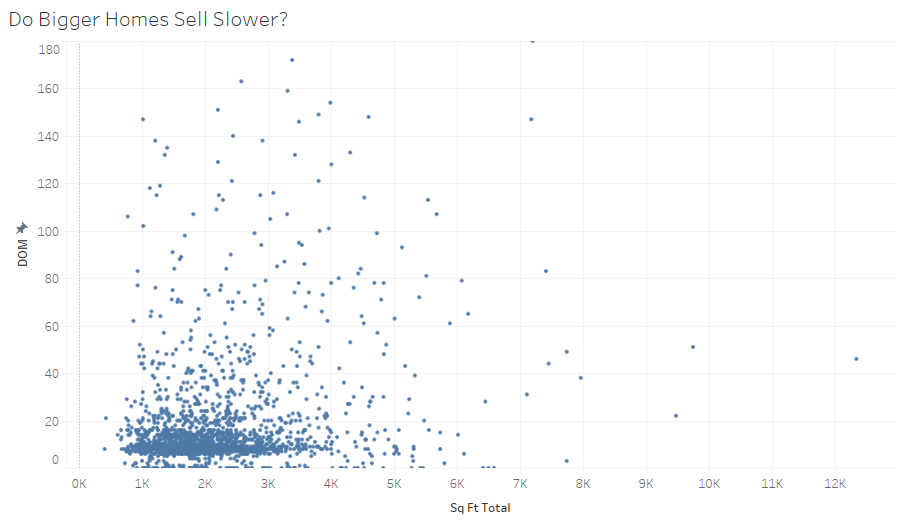
Yes they are.  The correlation is not as dramatic as common sense might suggest, but this is partially because slow-moving homes come in two flavors:  truly unique properties with a small universe of potential buyers, and mispriced homes.  As we have seen above, there are slow-moving homes at every price range, so this masks the correlation between longer DOM and unique properties.

Conclusion:  Both Average and Median Sales Price are related to Days on Market:  more expensive homes take longer to sell.  The correlation is not as strong as most might expect.

Listing Period Vs Days On Market

To compare apples to apples, sellers must remember that a Listing Period (the time your agent has exclusive permission to represent your home for sale) is not the same as the Days on Market.  The Listing Period is actually the sum of all the prep time (preparing disclosures, property inspections, potential repairs, painting, staging, photography, videography, marketing, broker tour, and much more) plus the actual time it takes your home to sell.

But Still, Quicker is Better, Right?

Not always!  The best price from the best buyer is usually what we try to optimize for.  Speed is good, but only if we are sure that we are getting every possible offer that could maximize the return on your investment.  Sometimes an auction model and its deadline-based approach is right for certain properties, but not always.

The clients of the Young Platinum Group, and of Golden Gate Sotheby’s International Realty in general, often possess truly distinctive properties which are unique, bespoke, and extraordinary.  These are often not mass consumption dwellings, but very custom expressions of personality.  Such homes can often be in that “10% of Palo Alto that does not sell in less than 40 days” bucket in the chart above.

Conclusion: 90% of Palo Alto homes sell in under 39 days of going on the market.  Unique, expensive homes are more likely to take more time.

In Summary

·         Days on Market has been remarkably stable over the past 5 years; the median home sells in 9 days.

·         The timing within the year when a home is listed does not materially affect its speed to sell.

·         Home size, lot size, and sale price are not strongly correlated with how long a property remains on the market, though sale prices above $4,000,000 do seem to suggest longer times to sell.

·         Both Average and Median Sales Price are related to Days on Market:  more expensive homes take longer to sell.  The correlation is not as strong as most might expect.

·         90% of Palo Alto homes sell in under 39 days of going on the market.  Unique, expensive homes are more likely to take more time.

Data analysis is great for macro-trends, but your home is assuredly not macro! Each property will have relevant comparables that may make your situation unique. The Young Platinum Group would be delighted to consult with you regarding your specific opportunity.